Recently I was tasked to created a line chart that showed movement of animals in an animal sanctuary over time. This data came in the form of survey counts taken each day for each area of the sanctuary like this:
| Area | Date | Count |
| Kennel 1 | 03/01/2019 | 100 |
| Kennel 1 | 04/01/2019 | 102 |
| Kennel 1 | 05/01/2019 | 101 |
| Kennel 1 | 08/01/2019 | 120 |
| Kennel 1 | 09/01/2019 | 121 |
You’ll notice that there’s a gap in the data between the 5th of January and the 8th of January. Not a big problem when we’re looking at one single area as Tableau will auto fill our missing dates:
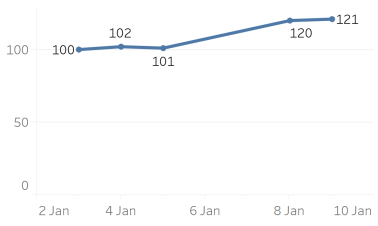
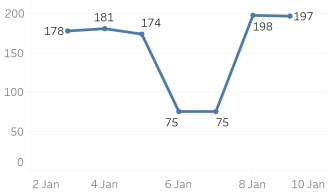
It’s pretty obvious we’re missing a day’s worth of data, and that’s fine here. We’re rightfully continuing on our data set. But what happens when we’ve got one set of records with every date recorded and one without? We take a big hit on the days we’re missing data:
How can we solve this problem? There are a bunch of different scenarios:
- Areas that have all days
- Areas that have all days up to a certain point x days ago
- Areas that are missing some dates up to the current day
- Areas that are missing some dates and the last record is y days ago
As you can see our data set becomes rapidly complex. Not particularly difficult to solve with SQL Server and a Tally table, but what happens when we’re restricted to the use of a Google Sheet that’s driven from a Google Form?
First create a calendar table with all of the dates in our data set:

Then we need to deal with any islands. Each record in our data set can be sorted by Area Name and Date. This allows us to find the date of the record previous to this one, we do this by sorting our data by Area Name and Date descending:
=sort('Form responses 1'!C2:K,1,true,2,false)
Then we need to add an ARRAYFORMULA to figure out the previous date:
=ARRAYFORMULA(if(A2:A=A1:A,B2:B,B1:B))
The needs to go in the first row and runs for each column and simply does:
If the Area Name for the current record matches the Area Name from the previous date’s row (this is why we sorted descending), we use the previous date, else we use the current row’s date. So we get output that looks like this:
| Area | Date | Count | Previous Date |
| Kennel 1 | 09/01/2019 | 121 | 08/01/2019 |
| Kennel 1 | 08/01/2019 | 120 | 05/01/2019 |
| Kennel 1 | 05/01/2019 | 101 | 04/01/2019 |
| Kennel 1 | 04/01/2019 | 102 | 03/01/2019 |
| Kennel 1 | 03/01/2019 | 100 | 03/01/2019 |
| Kennel 2 | 09/01/2019 | 76 | 08/01/2019 |
| Kennel 2 | 08/01/2019 | 79 | 07/01/2019 |
| Kennel 2 | 07/01/2019 | 72 | 06/01/2019 |
| Kennel 2 | 06/01/2019 | 74 | 05/01/2019 |
| Kennel 2 | 05/01/2019 | 74 | 04/01/2019 |
| Kennel 2 | 04/01/2019 | 76 | 03/01/2019 |
| Kennel 2 | 03/01/2019 | 76 | 03/01/2019 |
Now we have a date range that can be used to join to our calendar table in Tableau. If we join to our calendar table where the calendar date (in which we have every single date) is after the previous date, and less than or equal to the date of the record like below:

We now get a result that looks like this:

As you can see the Calendar Date fills in the gaps.
Dealing with data that’s not up to date uses the exact same technique, we just need to reverse the dates. So the Previous Date is now the date of the record and the Date is TODAY()-1, i.e. yesterday. There are a couple of steps to get this done in Sheets:
1: Get the all of the records where the last record we have is before yesterday:
=query(query('Form responses 1'!C:D,"select C,max(D) where C <> '' group by C"),"where Col2 < date '"&TEXT(DATEVALUE(today()-1),"yyyy-mm-dd")&"'")
So here we’re making a sub QUERY to get the max date for each Area Name, and then another QUERY to get just the records where the date is before TODAY()-1, i.e. yesterday. This would be easy in SQL Server by using a HAVING clause. We then need to get the count value for each of these records:
={"Heading";ArrayFormula(iferror(vlookup(A2:A&B2:B, {'Form responses 1'!C2:C&'Form responses 1'!D2:D, 'Form responses 1'!C2:L}, 9, 0 ), 0))}
I understand it’s difficult without an example, so when I get a chance I’ll put one together and provide a link. If you need one in the meantime, leave a comment and I’ll put something together.
The result is a line chart that has the latest count for each day and can show what would have been the count on any particular day chosen.