
There are many new technologies arriving all the time, but unless you’ve been living under a rock, you’ll have already heard about the impact the cloud is having on
business day to day.
One of the most exciting cloud offerings is the Microsoft Azure platform, based in data centres across Europe. Here you’ll be able to find everything from Linux Virtual Machines to web servers to HD Insight Clusters.
I’ve had the opportunity to travel to the Microsoft data centre in Dublin, and it is impressive as it is large. Moving to commodity hardware as the backbone of the platform allows normal users to gain access to massive clusters of compute power priced on usage. Imagine asking your boss if you could purchase a 100 node cluster for your server room just to play with for a few days? The Microsoft Azure platform grants you that ability for a fraction of the cost.
One of the most powerful offerings however is Microsoft’s cloud based Machine Learning workspace. This offering allows users to make use of powerful machine learning algorithms to solve the kind of problems procurement have been wanting to solve for years, namely how can we quickly improve our forecasts and predict outcomes?
Given that I work for an airline, the easiest place to start is with our very own type of product, flights. One of the things we need to make sure of as a business is that our flights arrive on time and our customers arrive safely and happily at their destinations without any delays. With this in mind is there any way we can use machine learning to predict flight delays? Of course there is. I’ll show you how below.
Step 1: Get your Azure Subscription
You can sign up for a free account here. This will allow you to test out Microsoft Azure and more specifically to this blog, Microsoft Azure Machine Learning.
Step 2: Sign in
Once you’ve signed into the portal you’ll see the dashboard.

Now go to Browse > Machine Learning

At the moment you’ll get taken back to the old Azure Portal (for everything other than ML always use the new one, it’s leaps forward)
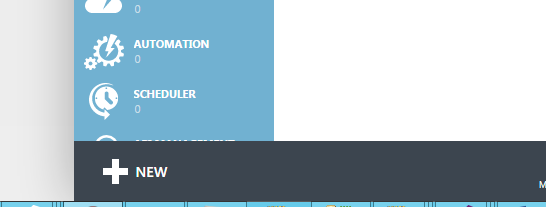
Step 3: Create a new experiment by clicking the big + sign that says NEW
You’ll be offered the below screen and you can go ahead and click Quick Create to set up your new experiment. You’ll need to add a new workspace name, select a location (West Europe is closest to us here in Leeds of the options). You will also need to create a new storage account to store your experiment data and the results of your experiments.

Azure will then go ahead and create you a new Azure Machine Learning workspace, pretty simple huh!
Step 4: Once your workspace has been created you can access it by clicking the Sign-in to ML Studio button:

Step 5: Create a new experiment
On the Experiments tab click the + NEW button and select Blank Experiment

Now you’ll be presented with a blank experiment, and now we can get started!

Pause to reflect
Let’s take a minute to explore the ML workspace. On the left of the canvas you’ll see Saved Datasets, Data Format Conversions, Feature Selection and many other areas, these areas contain modules we can use during our experiment. Machine learning in the format we’re using consists of a small number of parts:
1: Acquire data – Here we get the data we want to use
2: Select Columns – Here we select which values in our data set are important
3: Split data – This is an especially important concept to understand. In this step we need to split our dataset into two parts,1 for training the model and 1 for scoring the model.
4: Training Set: This set contains the thing we’re attempting to predict, in this case it will contain the columns used to do the predicting along with the value we’re trying to predict. It’s this set that the ML algorithm (we’ll learn about algorithms later) will use to work out which columns are important and how they affect the outcome, in our case we’re going to predict whether a flight is delayed by more than 15 minutes or not, i.e. delayed (1) or not delayed (0).
5: Scoring Set: In this set we don’t provide the outcome, i.e. whether the flight was delayed or not, rather we let the algorithm determine this value. Now because we already know the outcome we can test the predicted value created by the model against the value we already know. This is how we score our model and work out how accurate it is.
Using a very common business concept, we’ll split our data 80/20. 80 for training the model and 20 for scoring the model.
6: Algorithm Selection. This is where we pick which algorithm we’re going to use. There are a whole bunch to choose from and you can use this cheat sheet to work out which one is best suited to your problem. Because we’re only predicting whether the flight was delayed (1) or not delayed (0) we’ll be using a Classification algorithm.
!Remember! This is SCIENCE! This means we don’t have to get the algorithm selection correct the first time. It’s called an experiment for a reason, so run as many different algorithms as you can and mark down all of the results until you find the best fit. Maybe what you’re trying to predict can’t be predicted, that’s fine, science is all about having a hypothesis and testing it to see whether it’s true or not.
7: Evaluate model. This is where we test how well the algorithm has predicted what we asked it to. We’ll learn more about this later.
Now let’s get started!
Step 6: Get your data
Just to make things so much simpler for us, Microsoft have included an On Time Performance dataset that we can use. You can find it by clicking Saved Datasets > Samples > Flight Delays Data

Drag this over to the first space on your experiment canvas.
Now you can right click on the circle at the bottom and select Visualize. This will show you the data and give you some distribution graphs. Note that the ArrDel15 column contains 1’s and 0’s. This is boolean logic, 1 meaning true (is delayed more than 15 minutes) and 0 meaning false (isn’t delayed)

Step 7: Select columns.
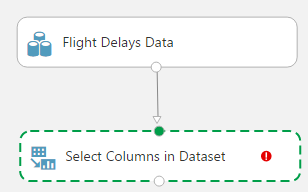
Here we need to go to the Manipulation menu and select ‘Select Columns in Dataset’

Next you’ll need to grab the small circle at the bottom of the Flight Delays Data dataset and drag down to connect it with the top circle of the Select Columns in Dataset transformation
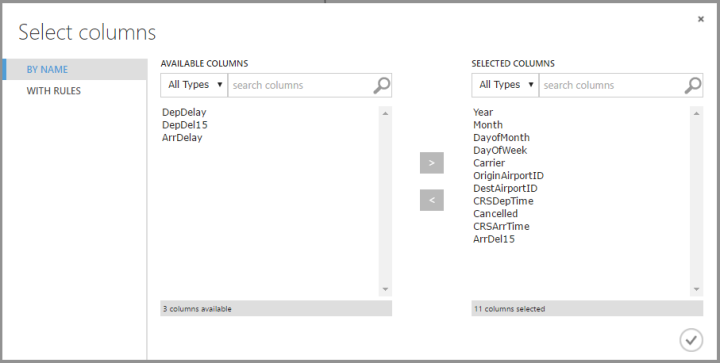
Now click the Launch Column Selector button to pick the columns we want to use

Don’t select all of the columns as selecting any of the delay columns will let the algorithm cheat by giving it the answers, i.e. if [ArrDelay] is over 15 then the chance of [ArrDel15] being 1 is 100% and the algorithm will pick up on this. It also makes sense that there’s a higher chance of the flight having an arrival delay if it it had a departure delay, so let’s exclude [DepDelay] and [DepDel15]. We only need to include [ArrDel15] as this is the column we’re trying to predict
Step 8: Split the data
This is where we split our data into training and scoring datasets. From the menu on the left, select Data Transformation > Sample and Split
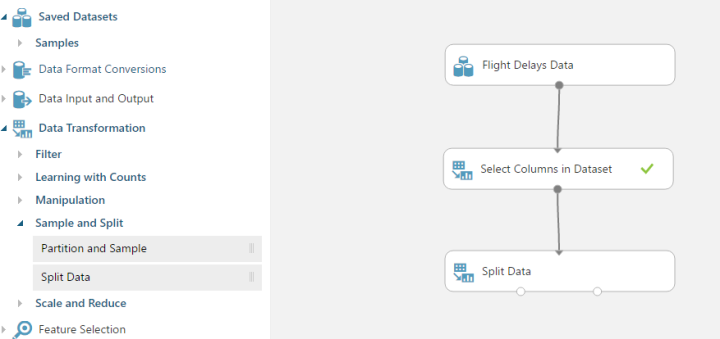
Now click on Split Data and you’ll see the properties pop up in Properties panel. Set the ‘Fraction of rows in the first output dataset’ to be 0.8, which is the 80% we mentioned before.
Step 9: Train the model
The Train Model transformation takes two inputs and has one output. The inputs are one side of the split data (this is our training set), and the algorithm we want to use.
From menu select Train > Train Model, drag it onto your canvas and join the right hand input to the output of the Split Data transformation. Then click on Train Model and in the properties panel on the right click the ‘Launch column selector’. This is where we pick the field we want to predict, in our case [ArrDel15], which is the field that shows if the flight was late arriving by more than 15 minutes.

Now from the menu select Initialize Model > Classification > Two Class Boosted Decision Tree, drag it onto the canvas and join it up to the left input of the Train Model transformation. Why I’ve chosen this algorithm is beyond the scope of this blog post and you can find more information here. For now you can test all of the Classification algorithms to see which one gives you the best fit.
Step 10: Score the model
This step will test how well our model has predicted our outcome.
From the menu select Machine Learning > Score > Score Model and drag it onto the canvas. Now we can connect the right hand output from the Split Data transformation up to the right hand input of the Score Model transform and the output of the Train Model up to the left hand input.
Step 11: Evaluate Model
This will show us the results of our experiment and whether we managed to predict our outcome. Remember this is an experiment and we may well find out we’re missing something or we need to find out more about our data, which is all fine.
From the menu select Machine Learning > Evaluate > Evaluate Model and connect it to the output of the Score Model transform.

Step 12: Run our experiment!!
Now we can run out experiment by clicking the run button

How did we do? Right click on the output of the Evaluate Model and select Visualize to find out. Here you can see an output of how well the model was able to predict whether each flight would arrive within 15 minutes or not. Below are the results we’ve achieved.
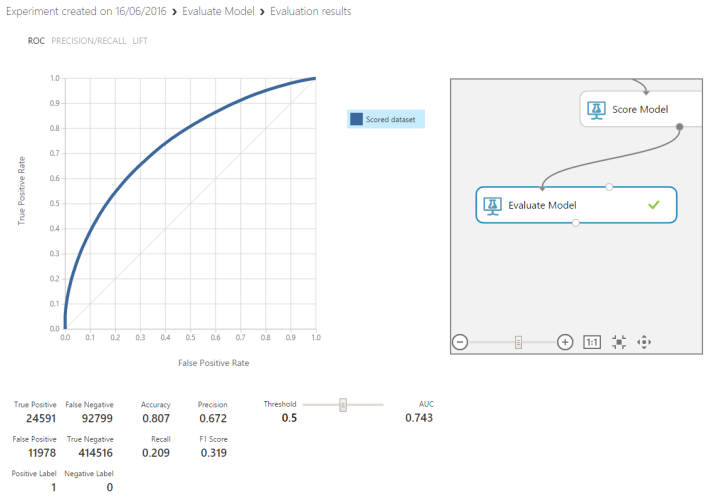
If you pay attention to the bottom left graph you’ll see the mix of predictions and results that the algorithm achieved

True Positive: The number of records the algorithm predicted would be true (delayed) that were true (delayed).
False Positive: The number of records the algorithm predicted would be true (delayed) that were actually false (on time).
False Negative: The number of records the algorithm predicted would be false (on time) that were true (delayed).
True Negative: The number of records the algorithm predicted would be false (on time) that were false (on time).
Accuracy: This is a ratio of correctly predicted results. This is the (True Positives + True Negatives) / The total number of records.
You can find out more information about Precision, Recall, and F1 Score here.
It’s obvious that we need more information to be able to accurately predict whether a flight will be delayed or not, but it gives a great introduction into how to use Azure Machine Learning, and we can now go on to augment our dataset with other predictor values, maybe weather or strike information might help, the possibilities are out there, it’s your job as a data scientist to find them! Good luck.
